[CGDI] Jump Flooding
==
In this TP, the idea is to implement a Voronoi map construction algorithm on grids, using a fast approximation called *jump flooding algorithm* (JFA)[^1]. Next, we will be using this algorithm to implement a [Lloyd's relaxation algorithm](https://en.wikipedia.org/wiki/Lloyd%27s_algorithm)[^2] for blue noise point sampling.
This algorithm is not exact in the sense that it may contain errors and is not optimal in terms of computational cost. However, it has several properties which makes it useful in some applications.

Given a set $\mathcal{S}$ of $N$ sites in an image $I:=[0,...,n-1]^d$, and if $\mathcal{V}_\mathcal{S}$ denotes the Voronoi diagram of $\mathcal{S}$ in $\mathbb{R}^d$, we are interesed in the restriction of the diagram to $I$, namely $\mathcal{V}_\mathcal{S}\cap\mathbb{Z}^d$.
In dimension 2, computing $\mathcal{V}_\mathcal{S}$ can be done in $O(N\log N)$, retrieving the cell of the diagram containing a given grid point is in $O(\log N)$, the overall naive algorithm for the restriction is thus $O(N\log N + n^d\log N)$.
:::warning
For interested readers, separable error-free algorithm exists for the computation of the Voronoi map in linear time with respect to the number of grid points (*i.e.* $O(d\cdot n^d)$), for a large class of metrics. Please have a look to this note [Distance fields and Voronoi maps](https://perso.liris.cnrs.fr/david.coeurjolly/courses/voronoimap2d/).
:::
For this practical and similarly to the previous one, you would just need a function to save an image.
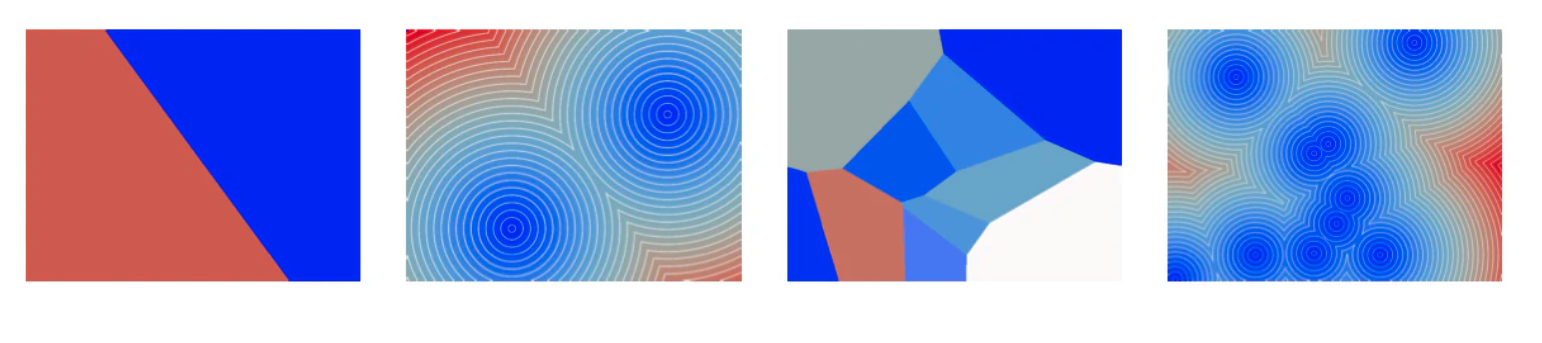
Note that, instead of outputting the Voronoi diagram and site labels, exporting the distance to the closest site gives you a distance field to a collection of sites:
# Warm-up and JFA
1. Set up you project to draw $N$ random points in an image.
The basic idea of the JFA is to propagate distances using a simple pattern. From an empty map, JFA of step length k
$$JFA(p) = JFA(q^*)\\
q^* = argmin_{q= p + (i,j)\,, \forall i,j\in\{-k,0,k\}}\|p - JFA(q) \|_2^2,\, \,.$$
In 2d, nine distances must be compared (8 neighbors + the current distance to the site of $p$)
2. Implement the JFA by increasing the grid step by one ($k=k+1$) at each iteration and output the obtained map. Evaluate the quality of your *Voronoi* map (for instance by checking the expected value using a naive closest point algorithm).
:::warning
Be careful with the boundary conditions...
:::
3. What is the computational cost of this algorithm? How many steps are required for a given pixel (that is not a site), to receive its first (maybe erroneous) Voronoi site assignment?
:::info
Given a sequence of images, if you have the `imagemagick` package installed on linux/macos, you can generate a gif from a series if images using: `convert myimages*.png toto.gif`.
:::
4. The original idea of JFA is to perform, starting from $k=n$, logarithmic jumps with decreasing steps $k = k / 2$, and to end with a final step 1 jump (JFA+1). The illustration above corresponds to this algorithm. Implement this approach, what is its complexity and parallelism properties?
5. Change the underlying metric to something else (*e.g.* [p-norms](https://en.wikipedia.org/wiki/Lp_space)), how does that impact the quality of the map?
6. Update your code to allow parallel (multithreaded) computations.
:::info
For this practial, [openmp](https://www.openmp.org) (`-fopenmp` as compiler option), would do the job here. E.g.
```c++
...
#pragma omp paralle for
for(auto pixel=0; pixel < n*n; ++pixel)
{
...
}
```
:::
# Lloyd's relaxation
[Lloyd's relaxation algorithm](https://en.wikipedia.org/wiki/Lloyd%27s_algorithm) is a widely used tool to evenly distribute samples in a domain (variant of [k-means](https://en.wikipedia.org/wiki/K-means_clustering) clustering algorithm).
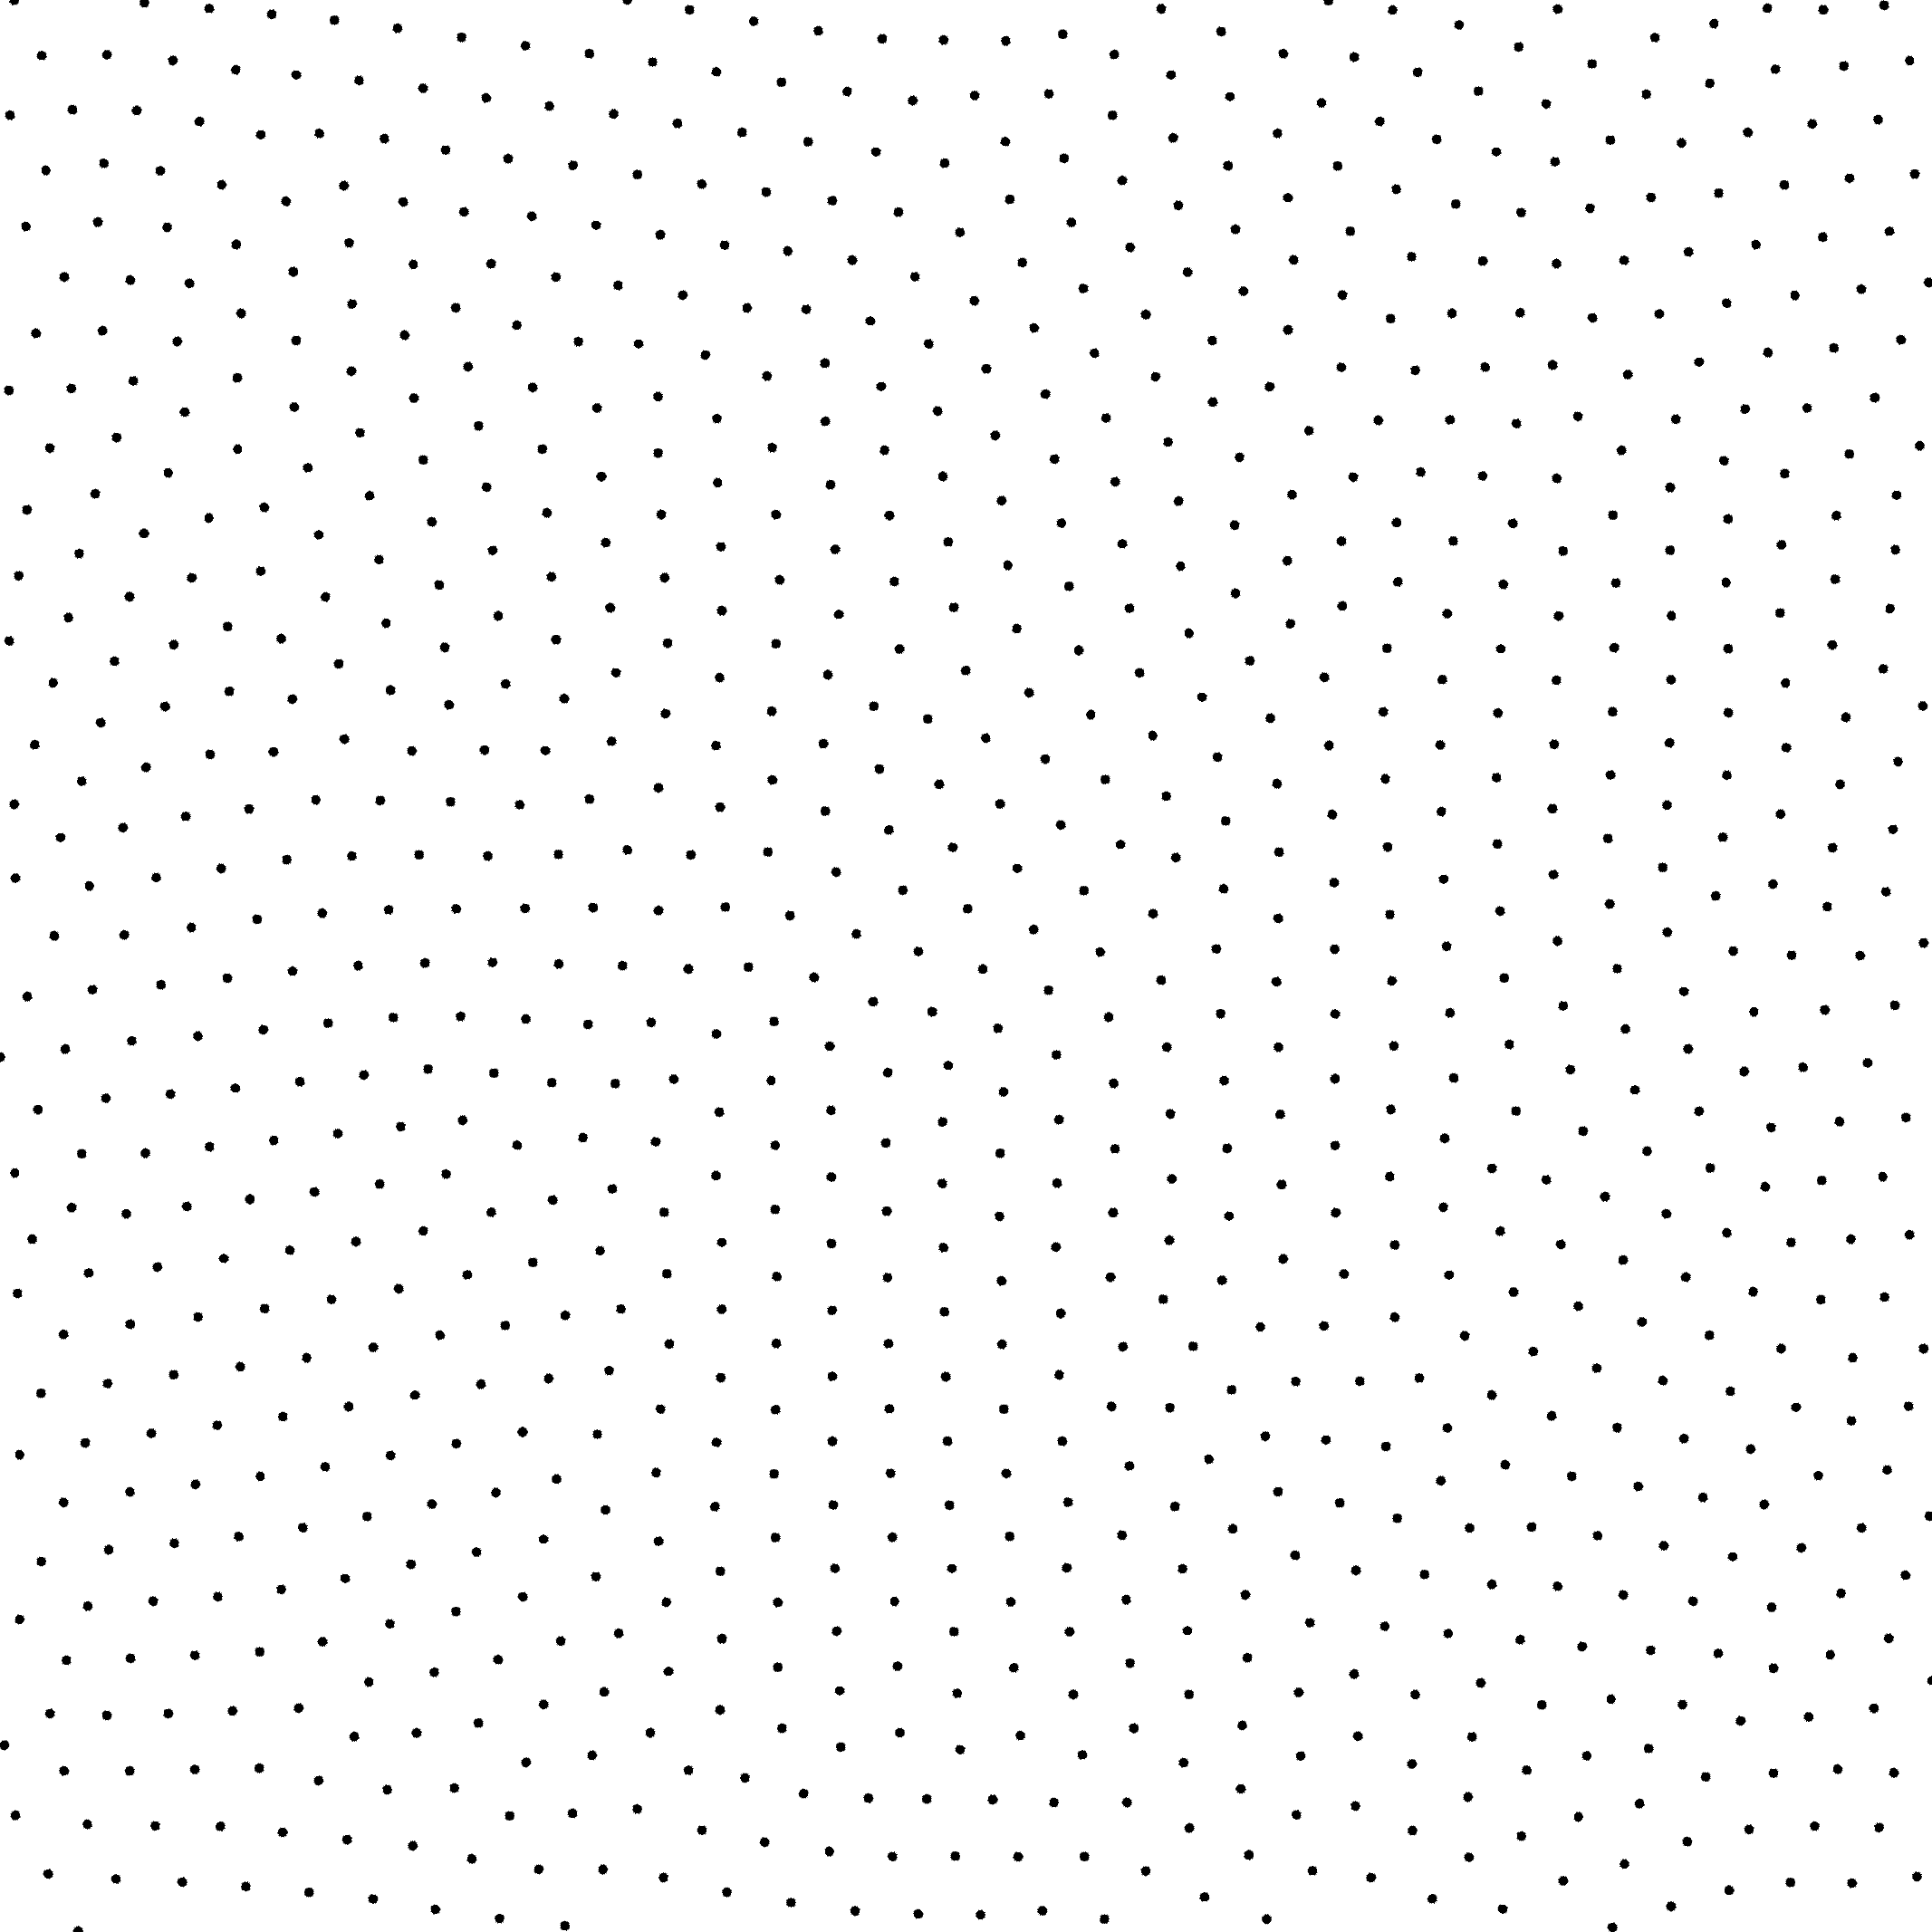
The idea is rather simple, Lloyd's is an iterative process such that at each step, you compute the Voronoi diagram of $N$ samples, and you move each site to the barycenter of its own cell. In this practical, we will approximate the Voronoi diagram using a discrete map obtained from the JFA.
7. Update the JFA code to compute the barycenter of each Voronoi cell. (**Rem:** either at the end of the jumps, or incrementally during JFA updates).
8. When seeing the *distance-to-barycenter* as an energy, what kind of structure minimizes such energy?
Just an example on the sphere (represented as the dual of the Voronoi digram, aka the restricted Delaunay triangulation of the samples):
{%youtube FO1yMchFXNc %}
[^1]: Rong, Guodong; Tan, Tiow-Seng (2006-03-14). "[Jump flooding in GPU with applications to Voronoi diagram and distance transform](https://www.comp.nus.edu.sg/~tants/jfa/i3d06.pdf)". Proceedings of the 2006 Symposium on Interactive 3D Graphics and Games. I3D '06. Redwood City, California: Association for Computing Machinery: 109–116. doi:10.1145/1111411.1111431. ISBN 978-1-59593-295-2. S2CID 7282879.
[^2]: Lloyd, Stuart P. (1982), "Least squares quantization in PCM", IEEE Transactions on Information Theory, 28 (2): 129–137, doi:10.1109/TIT.1982.1056489.