---
tags: SPICE, Qt, Quicklook
---
# 2023-09-26 Quicklook Qt meeting
Participants: **David, Frédéric, Éric, Claude, Alfred**
* [Previous notes](https://codimd.math.cnrs.fr/l4T7u6INTHC3H7CXNMvuaw?both#)
* [Next notes](https://codimd.math.cnrs.fr/qUGG2nXXQ9u0FHohWA-e8Q?both)
Name: SQKL Viewer?
## Questions
Questions are spotted by :question: below, please answer them when you see them...
## Ready to be checked :checkered_flag:
- Some icons looked dark under windows (from Fred's computer)
- OK
- Put "Plots", "Levels" and "Zoom" options in QGroups so that there is a frame (to isolate them better).
- OK
- When loading remote data, several seconds delay before progress bar is displayed -> show progress bar before + hourglass
- OK, there is a first bar appearing immediately, the loading time itself cannot be controlled and there can be no progress bar for this.
- Nope, marche paaaaas (on Fred's computer, Windows 11)
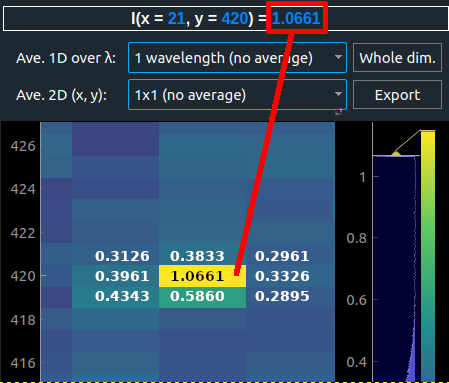
- Improve pixel accuracy in maps, see image below: (from Susanna's request)
- OK
- Issue: zoom is looping -> implement a max
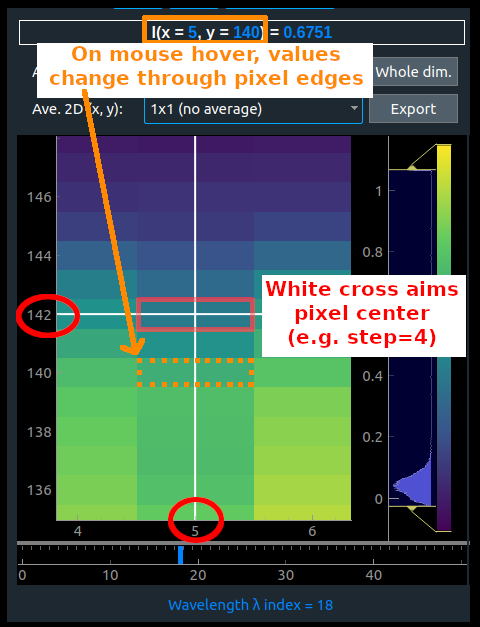
- Same idea: update profile $I(\lambda)$ when the cross (white line) is moved through pixel edges, see below:
- OK
- Fix pixel value on mouse hover:
- OK
- Remove "Apply" button in global levels and add a thread that triggers when field value changes, stop previous threads if another field changed quickly or if Global radio button is checked (because local levels were potentially changed since)
- OK
- Values > 100 are not caught properly before being passed to nanpercentile()
- Add buttons to cancel running processes in the footer, show whether they are done or cancelled then
- OK gagné!
- Cancel stops change of levels for current window, but does not cancel already done changes
- Fixed: spectral profile bars seem to be shifted compared to fit
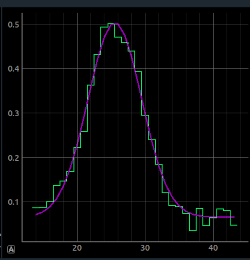
- OK
- Fit color changed to purple (fine for black or white backgrounds)
- Much nicer!
- $\lambda$ indexes are now kept in $I(\lambda)$

- OK, but force lambda range to be fixed. Range should change only when zooming.
- Need to display fit values & pixel values as binned (or not) data values. Need to keep 3 cubes: original, binned & 8 bits scaled.
- Cross in maps more visible, color black or white according to selected background

- OK
- Fixed: max % levels text boxes too small
- OK
- Change size policy of left part of splitter so that left panel takes always the minimum size required
- Bug on windows: Open file - > Cancel - > Frozen
- Add shortcuts for open file (Ctrl O)
- Changing scale to logarithmic or other (and pressing Apply) has no visible effect
:question: Code reviewed but same result, what's wrong? below:
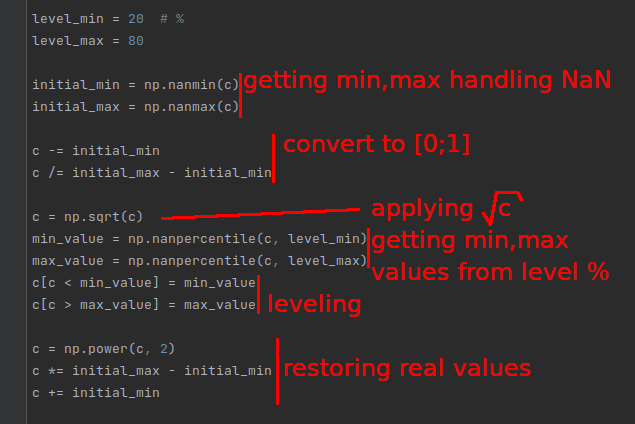
- Nothing wrong! Find the min max first (on orginal data), then apply stretch. Eventually use astropy.visualization AsymmetricPercentileInterval and LinearStretch / SquareRootStretch / LogStretch
- By default, set "lambda rescaling" to 15 (not 1)
- OK
- Limit "de-zoom" to original value
- OK, but apply also to profile
- Fred: To test Gaussian fits in a difficult case, David: I used max value, issue with barycenter if several peaks, see below

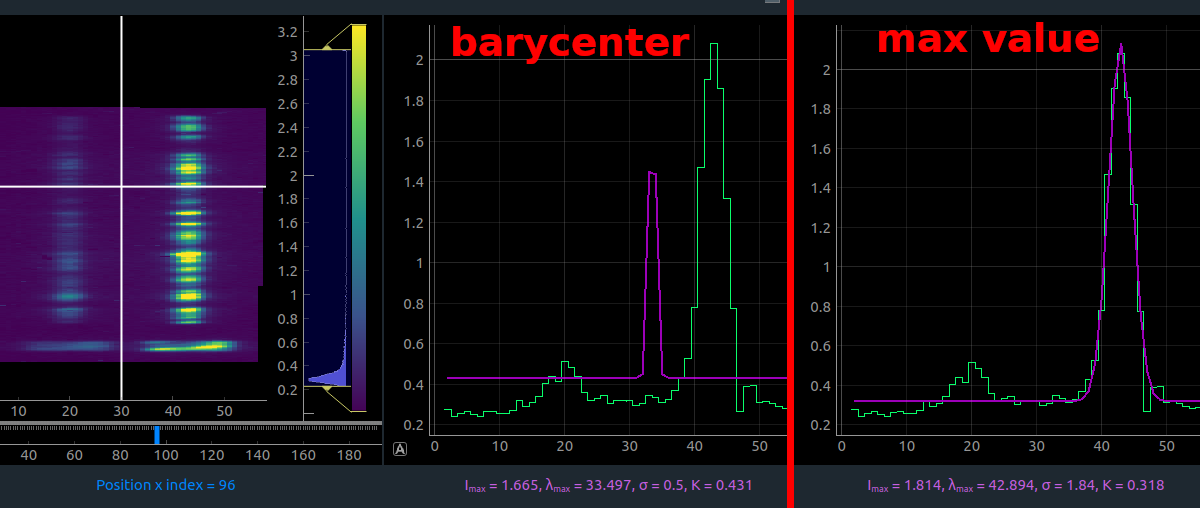
- OK
:question: David: here is a thought, can we compute $\chi^2$ and keep trying to fit with different bounds and different ways (val max, barycenter, other...) as long as $\chi^2$ is bad, we stop when $\chi^2<C$
- Naaaaaan
- but add χ² value next to fit parameterd
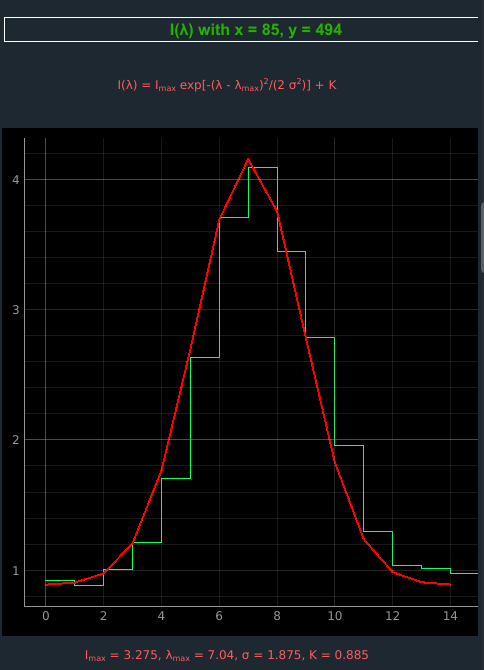
- Fred: Fits for the file below works well (all windows), David: still seems ok with the new code
- Great !

- Use unicode λ and σ where possible (in order to make checkbox's labels work on click) (David: done, labels on click works but we lose the subscript position for $I_{max}$ and $\lambda_{max}$)
- OK, remove the max
- Force tooltip design (background white instead of low opacity on some systems)
- Soom tooltips not opaque yet ...
- Rename "Zoom options" to "Zoom"
- OK
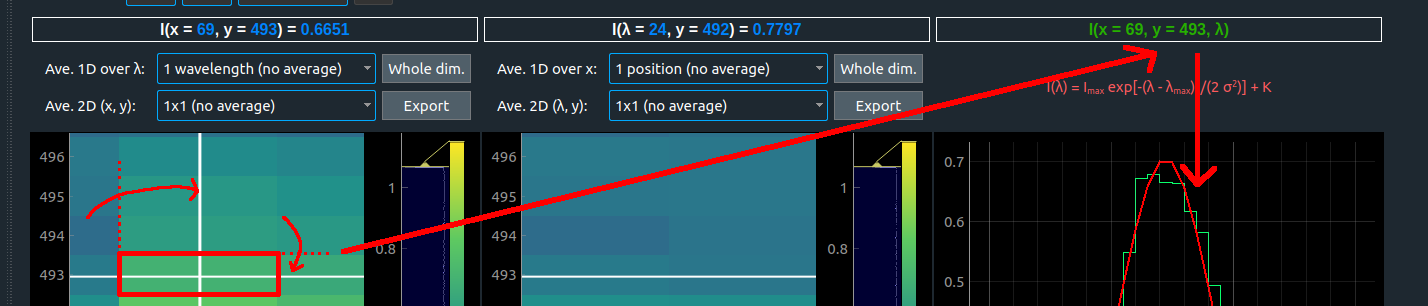
- Rename title above $I(\lambda)$ e.g. "$I(x=12, y=230, \lambda)$"
instead of "$I(\lambda)$ with $x=12, y=230$"
- OK
- Fit maps bars: default range should be wider (than y∈[200;800]), and there should be no lower limit at 200px
- OK
## Remains to do
- The fitted curve (in purple) could be drawn with a better x-resolution than the data
:question: David: I will do it next. Do we want to perform this only for the display or in every fit map calculation?
- Connect export button to pyqtgraph export menu
:point_right: *There is an issue with that: for the moment I can make it work only if the right click was done by the user first. It creates or "unlocks" some objects, required by pyqtgraph to display the export menu.*
- Adapt app. to Full Spectrum input files (i.e. STUDYTYP == Single Exposure): remove map x,y, gaussian fit and fit maps
- Review pop-ups with explanations
:question: Shall we replace them by a link to the user documentation instead?
- Sort processes in the footer (by running ones, then date)
## Other questions
:question: Do we want the "leveled" or original values in $I(\lambda)$?
- Put real values here
Example:
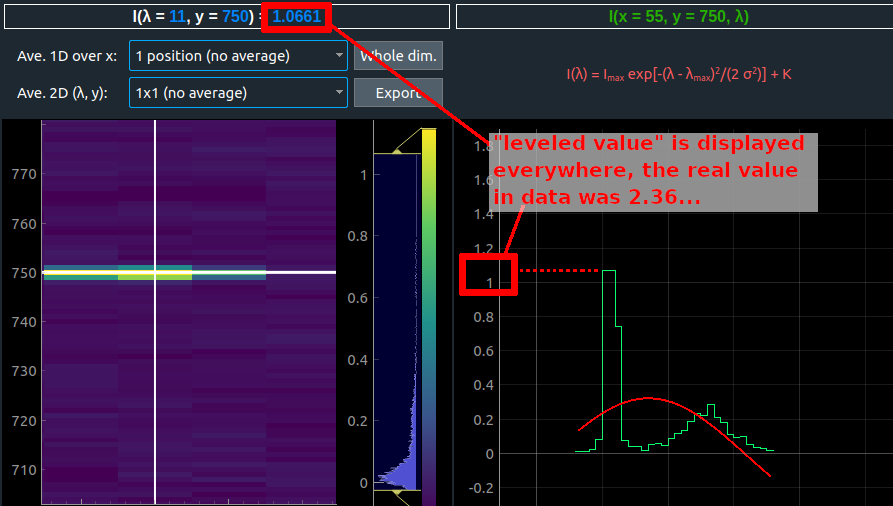
:question: By the way, we could also suggest to crop the left part in $I(\lambda)$ (instead/besides max level treshold) in order to compute a relevant fit in this case?
- original values