---
tags: SPICE, Qt, Quicklook
---
# 2023-07-07 Quicklook Qt meeting
Participants: **David, Frédéric, Éric, Claude, Susanna**
* [Previous notes](https://codimd.math.cnrs.fr/FsL3R3LRRq6sX2doKEYasQ?both#)
* [Next notes](https://codimd.math.cnrs.fr/pnaSH3RzQaufDrbjpBcQQw?both)
## To do
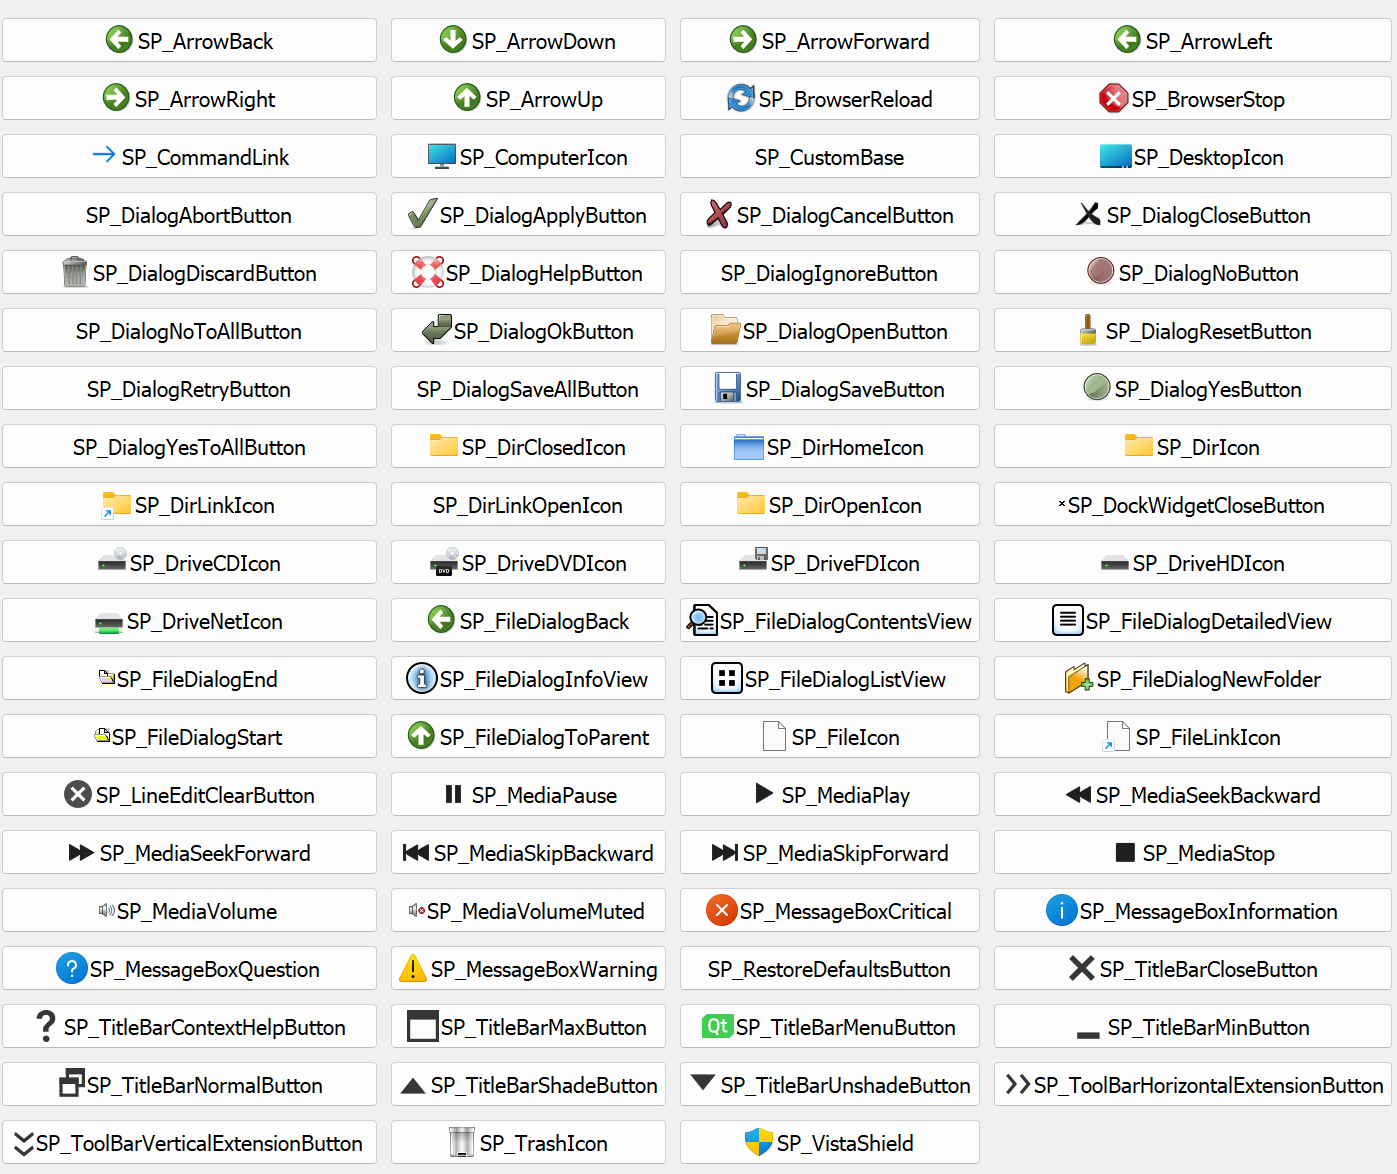
- Some icons look dark underwindows. Here is a list of standard ST icons under windows
- When loading remote data, several seconds delay before progress bar is displayed -> show progress bar before? + hourglass?
- Put "Plots", "Levels" and "Zoom ~~options~~" options in (QGroups?) so that there is a frame (to isolate them better).
- Rename "Zoom options" to "Zoom"
- Limit "de-zoom" to original value
- By default, set "lambda scaling" to 15 (not 1)
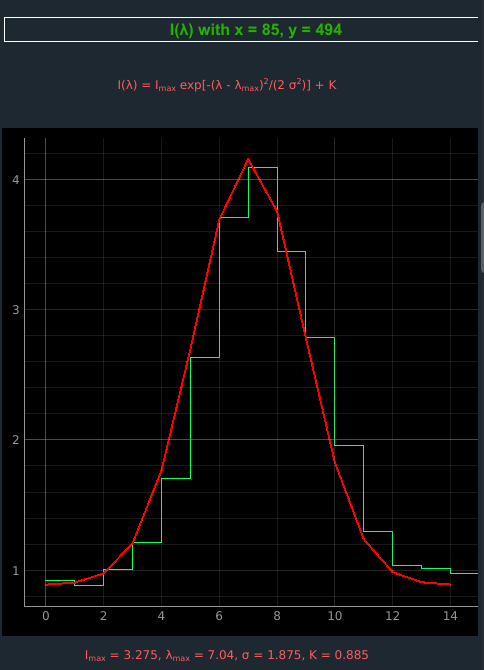
- To test Gaussian fits in a difficult case:

- Fits for this file work well (all windows)

- Max % textBox too small
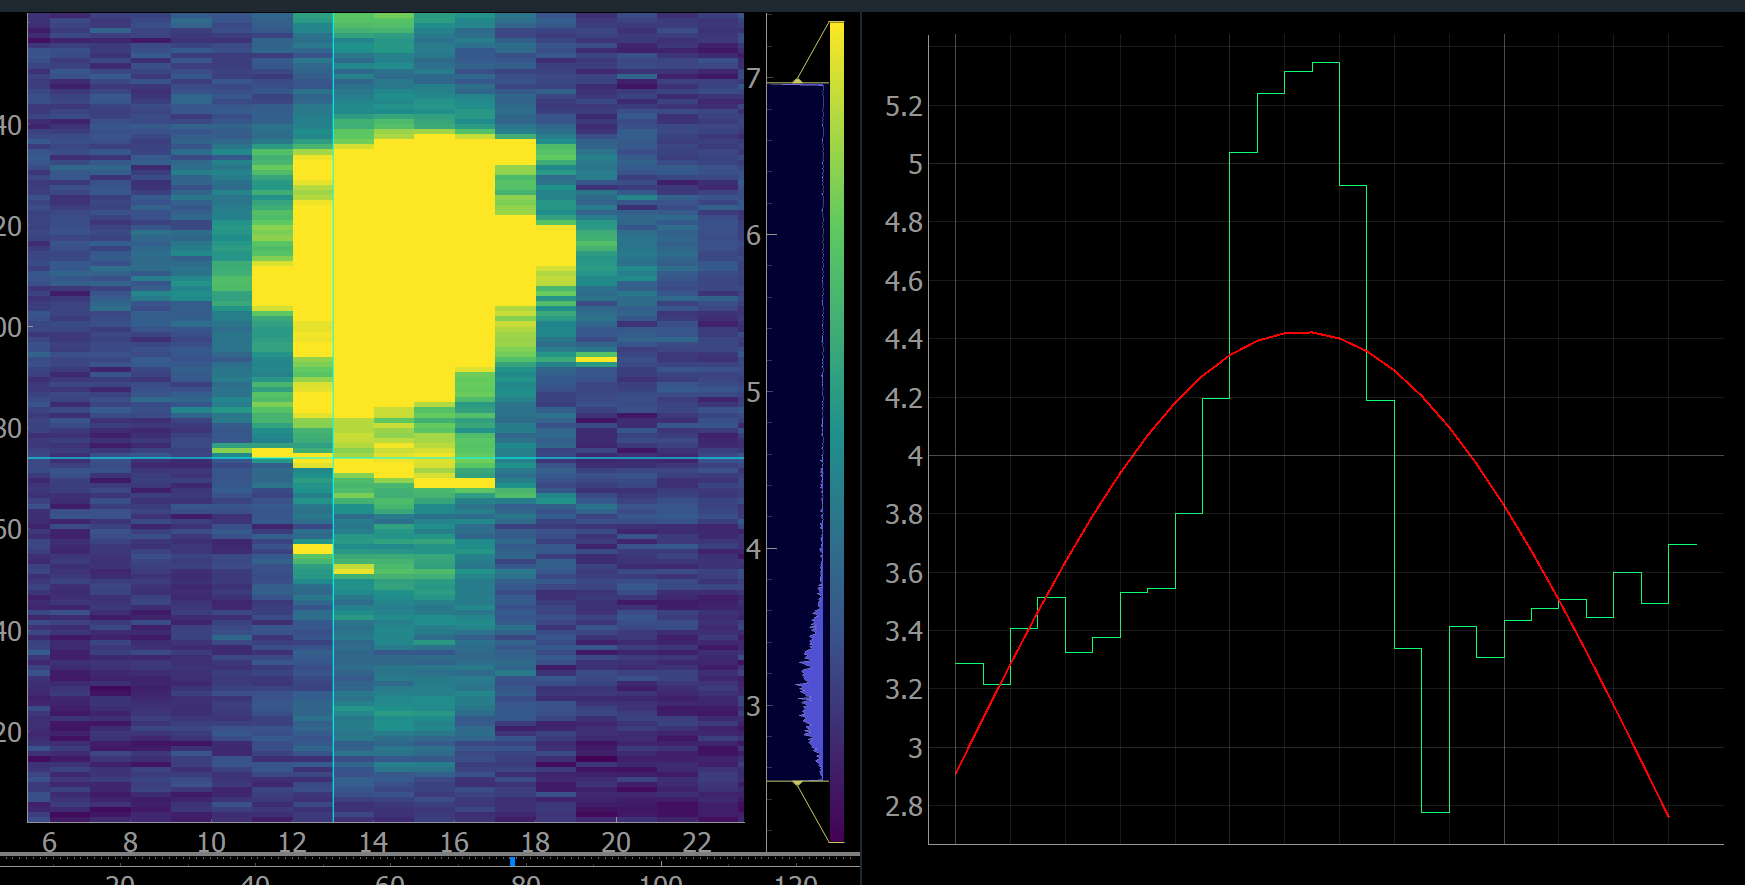
- Spectral profile bars seem to be shifted compared to fit (and then to data), bars should be centered on data points. The fitted curve (in red) could be drawn with a better x-resolution than the data
- Changing scale to logarithmic or other (and pressing Apply) has no visible effect
- Use unicode λ and σ where possible
- Check the correspondence of the spatial pixel vs. spectral profile.
## Ready to be checked :checkered_flag:
- Set tooltips everywhere to explain what buttons and options do
- Force design (background white instead of low opacity on some systems)
- Restore (actually remove) NaN values instead of showing zeros in the $I(\lambda)$ histogram so that the gaussian fit doesn't take into account zero values, adapt fit maps calculation as well
- OK but restore real lambda index (lost when NaN are removed)
- Set 1-99 % as default levels
- OK
- Horizontal grey bars for fit maps generation were not visible enough
- OK but default range should be wider, and there should be no lower limit at 200px
- Show only once the warning about the usage of those bars
- OK
- Show all the header information with a scroll area in the message boxes (see "i" buttons) instead of using an extra "Detailed text" button (that displays plain ugly black text)
- OK
- Review titles in the left menu (Appareance --> Plots, Gradient --> Color bar, ...)
- OK but remove "options" in Zoom options
- Review text colors in order to have a global display more "understated" and avoid red text on black backgrounds
- Review colors for $I(\lambda)$ and fit for black and white backgrounds
- Move the "i" button (showing the FITS file header) from menu bar to near the data file name
- OK
- Hide ticks (colored triangles) in the level histograms
- OK
:point_right: _Pyqtgraph restore 2 ticks by default when updating maps (and when user changes map colors), we force "0 tick" each time._
- Folders venv, env, .venv and .venv must be git ignored
## Doing now
- Connect export button to pyqtgraph export menu
:point_right: _There is an issue with that: it works only if the right click menu was open at least once before (because it's creating useful objects for pyqtgraph to make the export menu work)_
- Adapt app. to Full Spectrum input files (i.e. STUDYTYP == Single Exposure): remove map x,y, gaussian fit and fit maps
- Add a button to cancel a running thread (partially done, only the button is missing: processes are already interrupted when another data file is loaded)
## Formerly checked
- By double-cliking you can aim a $(x,y)$ or $(\lambda,y)$ position in one shot instead of moving horizontal and vertical bars
- OK
- Show thread progresses in the footer
- OK
- When moving a slider, update everything in real time (i.e. other related sliders, $I(\lambda)$ plot, ...)
- OK
- Show mouse coordinates on mouse hover (+ $I$ value)
- OK
- Add a button to reset zoom (triggers "View All")
- OK
- Fix level option especially for $log$ and $sqrt$ methods (it crashed) and prevent user to click on "Apply" twice
- OK
- Automatically reset zoom (View All) on $I(\lambda)$ each time it must be updated
- OK
- Find a way to exclude dumbbells in fit maps generation (even better: the user can now select a small region of interest thanks to the grey bars in the $I(x,y)$ map before generating it)
- Bars are not much visible
- No need to redisplay the message each time
- Fix: reload several data files crashed the app
- Working up to now
- Abort processes when user loads another data file (--> interrupted progress bar in the footer changes to red)
- OK
- Show more study and window details (slit, ...)
- Change to show all as a list
- Fix: moving the $y$ horizontal bar worked for the 1st window but didn't correctly for the other ones
- OK
- Add an offset $+ K$ in the gaussian fit
- OK
- But the NaNs seem to be considered as 0 for the fit and 1D fit plot, they should remain NaN. Also for the 2D map fit.
- Review the layout of the local level option in order to put side by side a maximum of window blocs, e.g. to view all the $I(x,y)$ maps
- OK
- Remove the $y$ slider, the $y$ value is only handled by the horizontal bars
- OK
- Show number of current running threads
- OK
- Hide ROI and Menu buttons next to maps
- OK
- Clarify $x, y, \lambda, t$ next to NAXIS values
- OK
- Do not show NaN warnings, no reason to worry, they are in the data
- OK
- Sometimes by default, the right part of the $I(x,y)$ map was not visible, "View All" is triggered after loading the maps to fix it
- OK
- Moving hardly the 3rd dimension slider of the second map shouldn't freeze the app anymore
- OK
- Fix: the fit maps titles were wrong after moving the mouse over one of it
- OK
- Add pop-ups to explain what the user can do with fit maps
- OK